

In today’s data-driven world, businesses are inundated with information from multiple sources—CRM systems, marketing platforms, sales tools, and more. But without a unified approach to data analytics, this wealth of information can become overwhelming and underutilized. The key to unlocking its full potential? Unified data analytics.
By consolidating your data into a single, cohesive platform, you can gain deeper insights, make smarter decisions, and drive exponential growth. Here’s how:
What is Unified Data Analytics?
Unified data analytics is the process of integrating data from various sources into a single platform to provide a comprehensive view of your business. This approach eliminates data silos, ensures consistency, and enables real-time analysis, empowering you to:
- Identify trends and patterns.
- Make data-driven decisions.
- Optimize operations and strategies.
- Predict future outcomes with greater accuracy.
Why Unify Your Data Analytics?
- Break Down Data Silos: When data is scattered across different systems, it’s hard to see the big picture. Unifying your analytics brings all your data together, providing a 360-degree view of your business.
- Improve Decision-Making: With unified data, you can access accurate, real-time insights that drive smarter, faster decisions.
- Enhance Customer Experiences: A unified view of customer data allows you to personalize interactions, improve satisfaction, and boost loyalty.
- Boost Operational Efficiency: Streamline processes by identifying inefficiencies and optimizing workflows based on actionable insights.
- Drive Growth: By uncovering hidden opportunities and predicting market trends, unified data analytics can fuel innovation and growth.
How to Unify Your Data Analytics
- Choose the Right Platform: Invest in a robust analytics platform that integrates seamlessly with your existing tools and systems. Popular options include Tableau, Power BI, and Google Data Studio.
- Centralize Your Data: Use a data warehouse or lake to store and organize data from multiple sources. Tools like Snowflake, Amazon Redshift, or Google BigQuery can help.
- Automate Data Integration: Leverage ETL (Extract, Transform, Load) tools to automate the process of collecting and consolidating data.
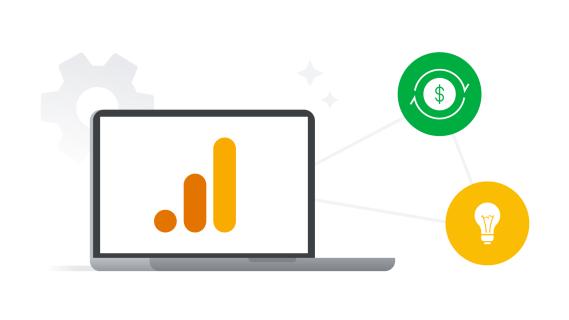
- Visualize Your Data: Use dashboards and reporting tools to transform raw data into easy-to-understand visuals. This makes it easier to spot trends and share insights with stakeholders.
- Ensure Data Quality: Regularly clean and validate your data to maintain accuracy and reliability.